Rehearse race day before it happens.
RaceSim simulates a full HYROX-format race with 200+ athletes. Each one is an independent agent with their own pace, fatigue and heart rate, so queues, bottlenecks and finish times emerge on their own. Change an operational decision and watch what happens: equipment going down, wave spacing, field size, station layout, staffing.
What one decision does to race day
The same seeded field of 200 athletes (waves of 16 every 10 minutes), run once per scenario. "Queued" means the athlete waited for equipment at least once. Event end is the race clock when the last athlete crosses the line.
| Scenario | Queued | Avg wait | Avg wait per athlete | Event end |
|---|---|---|---|---|
| Baseline10-min waves | 49% | 1:06 | 4:49:53 | |
| 7 of 14 SkiErgs down | 80% | 3:47 | +4.5 min | |
| 3 of 9 sled-push lanes down | 67% | 1:52 | same | |
| 5 of 13 rowers fail at 1:00 | 71% | 2:55 | same | |
| Waves every 6 min | 75% | 3:05 | 48 min earlier | |
| Waves every 4 min | 90% | 10:03 | 58 min earlier | |
| Waves of 24 instead of 16 | 73% | 3:11 | 40 min earlier | |
| 300 athletes, same plan | 61% | 1:43 | +1:30 h |
Simulated, not measured. Athletes are synthetic, calibrated to 2026/27 HYROX results (division medians within about 1%). Your venue, equipment and field will differ, so run your own scenario in a couple of minutes.
What you can use it for
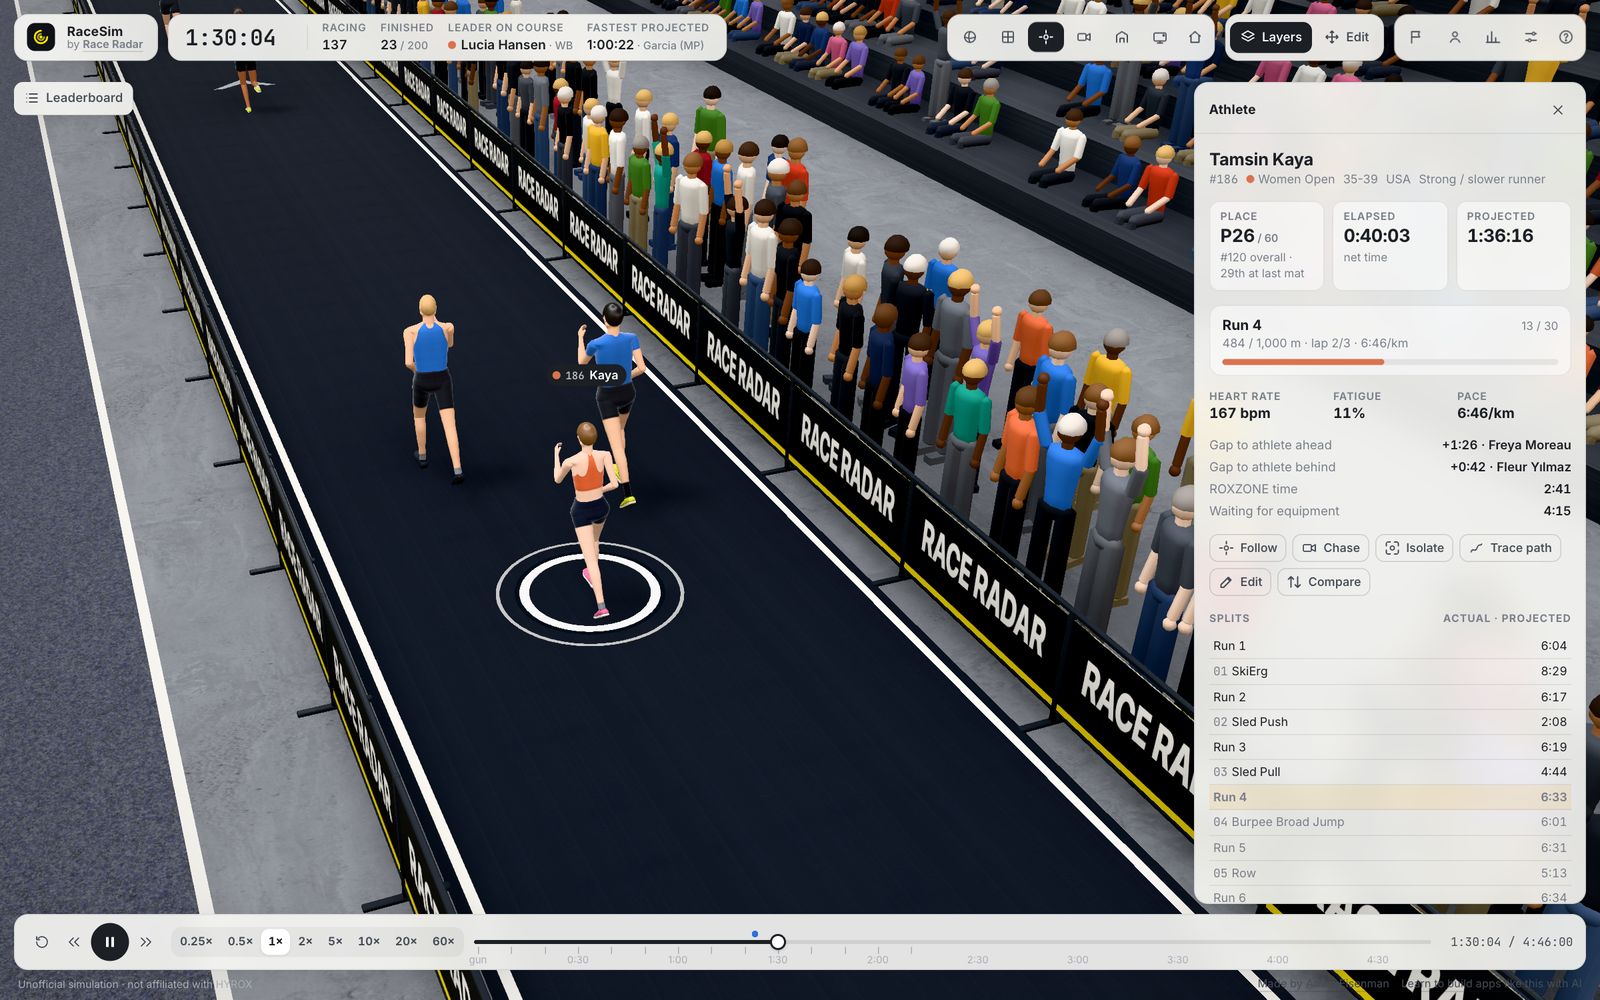
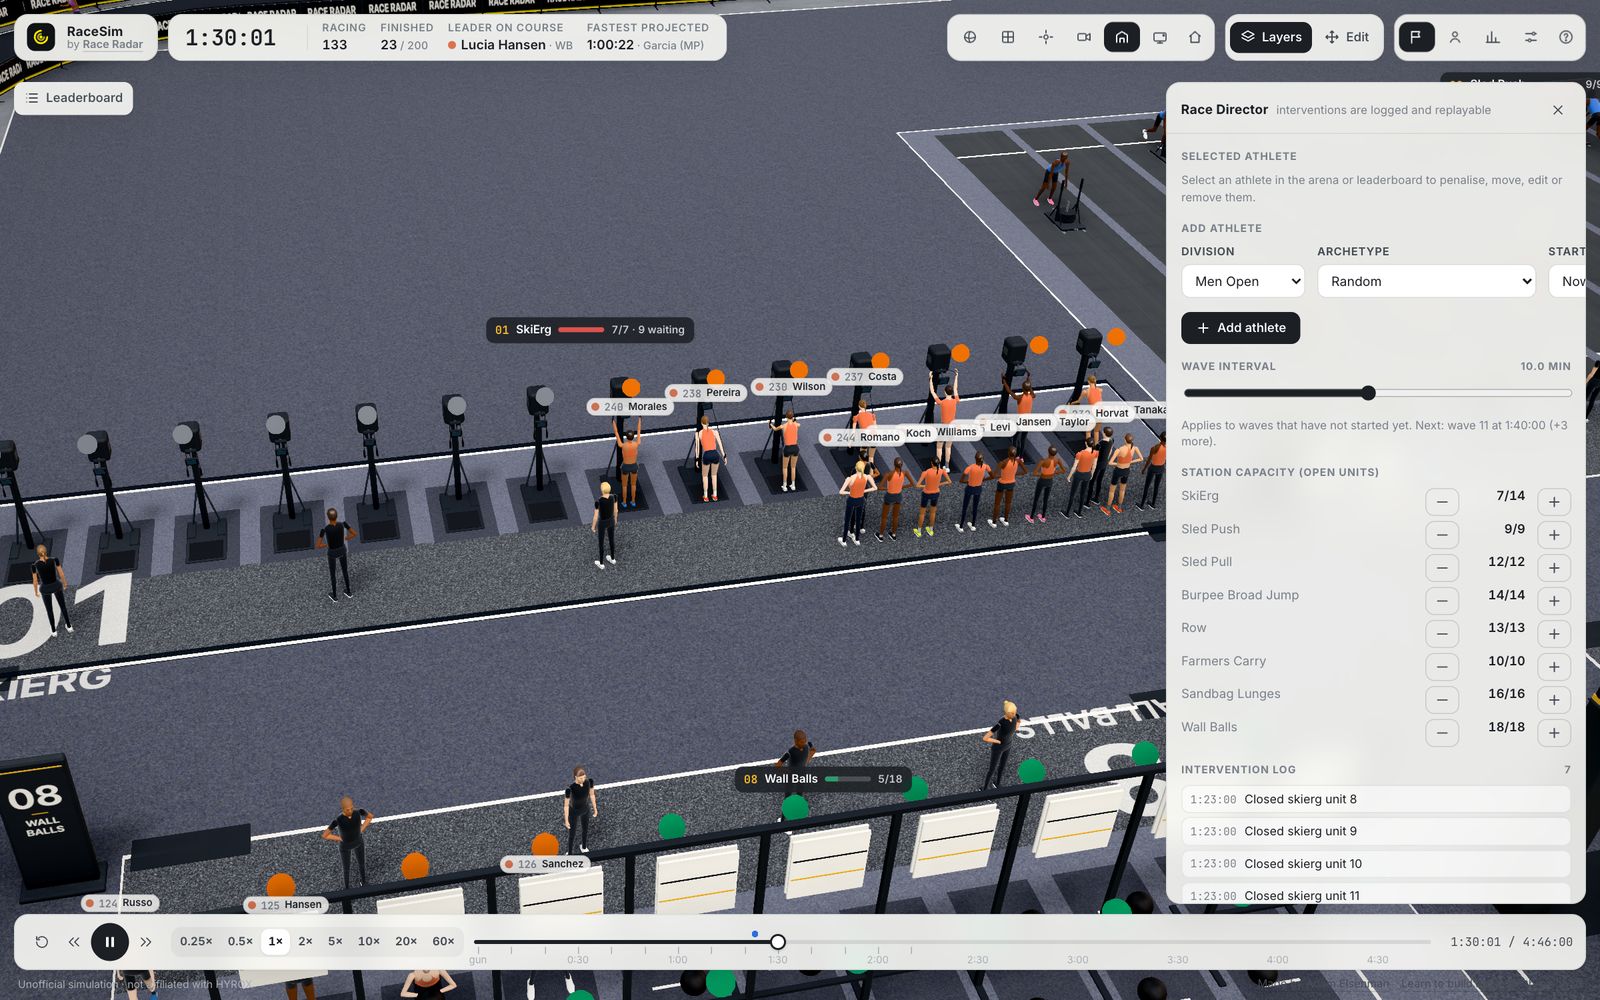
Equipment-failure drills
Close any unit live from the Race Director panel and watch queues form. See who loses time and how much: every athlete card shows "Waiting for equipment".
- Decide how many spares each station needs
- Plan the call: hold the wave, reroute, or accept the queue
- Every intervention is logged and replayable
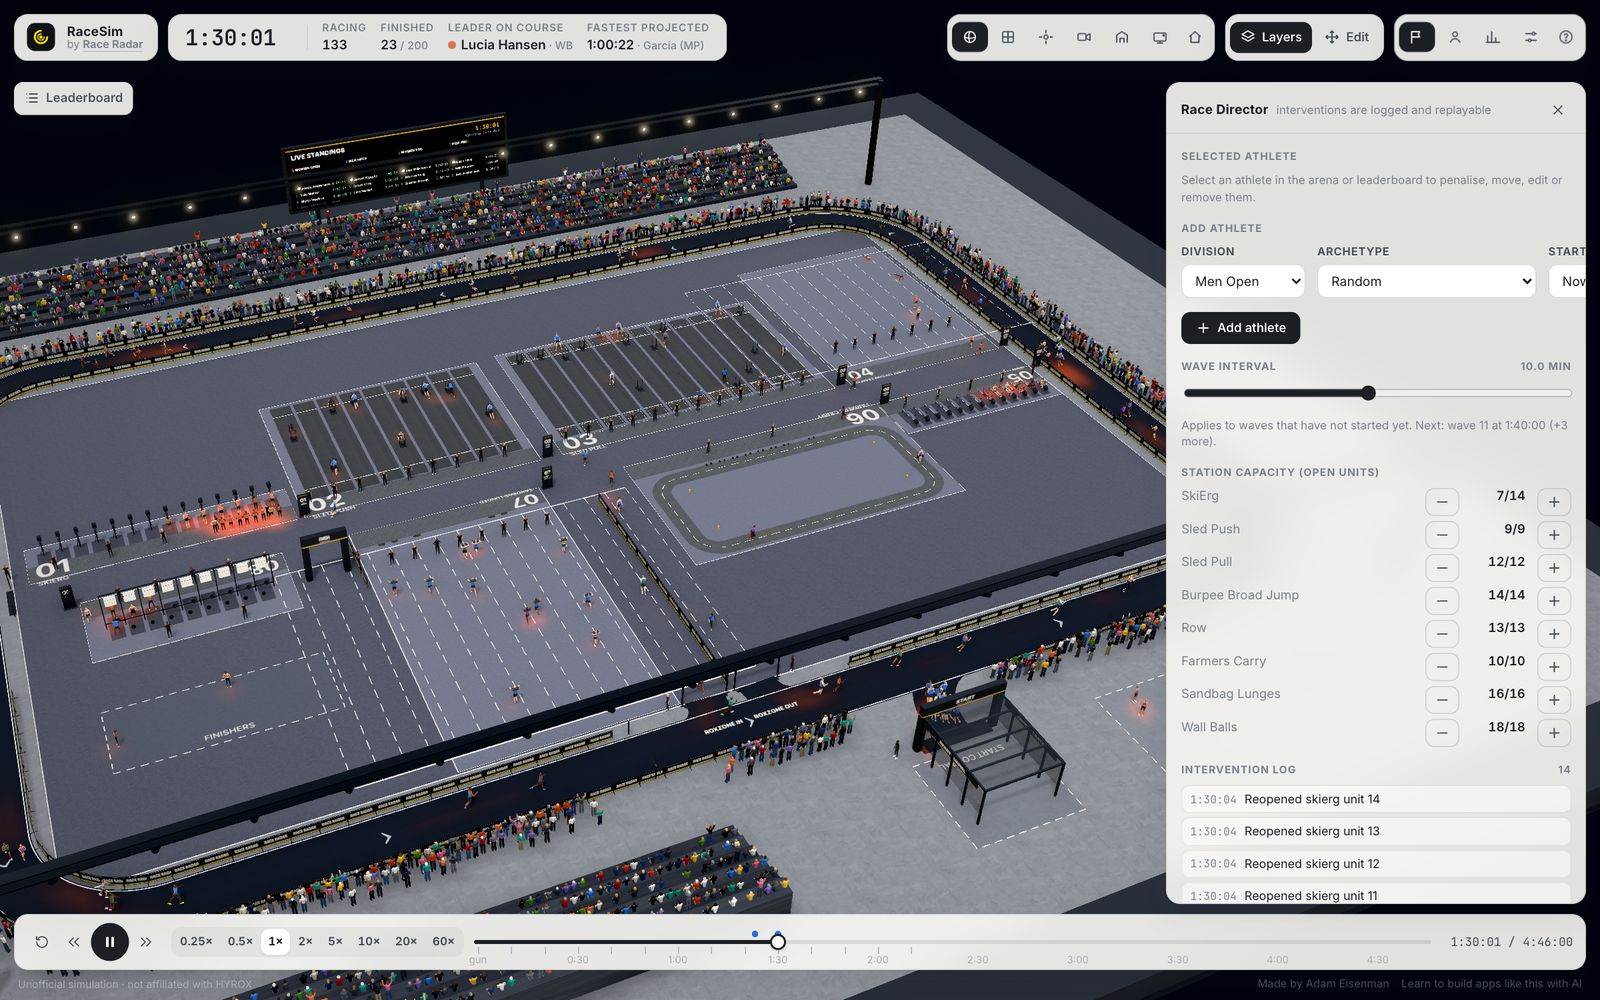
Wave spacing and field size
Drag the wave interval, change wave sizes, add athletes or whole waves. The heatmap shows where density builds at the busiest minute of the day.
- Find the tightest schedule that still runs clean
- Size heats for a bigger field before you sell the extra slots
- See exactly when and where it gets crowded
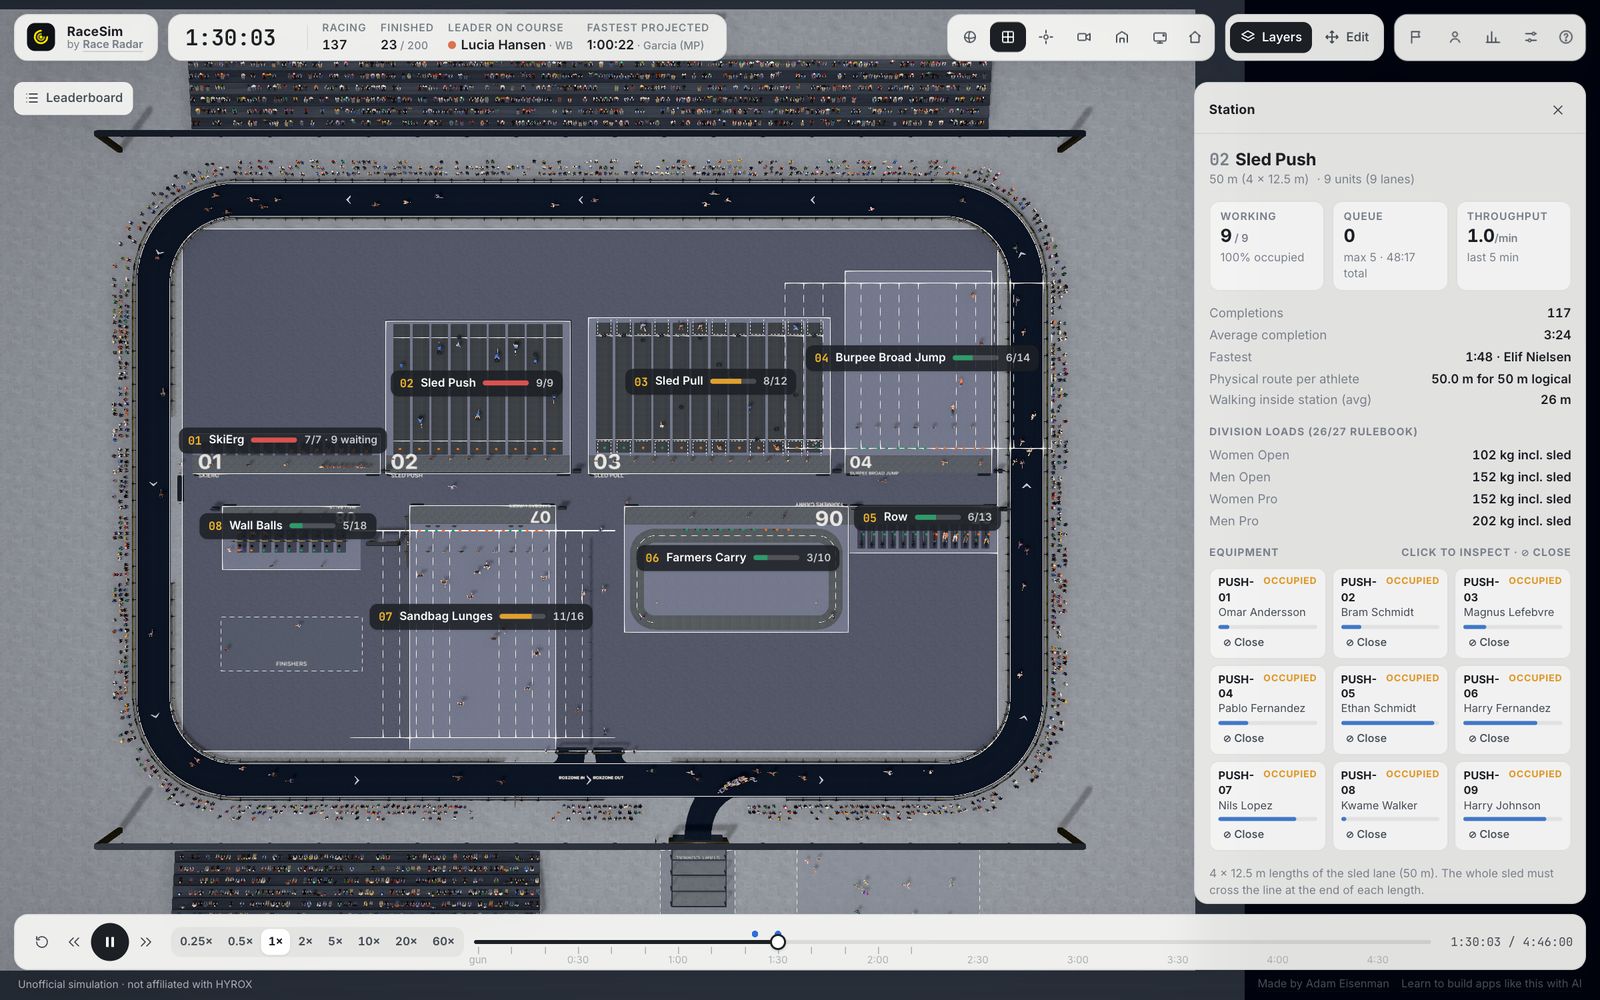
Station capacity and bottlenecks
Every station reports units working, queue length (with the day's peak), throughput per minute, completions and average time, with a per-unit equipment view.
- Match equipment counts to the field you're expecting
- Spot the station that limits the whole day
- Compare divisions and loads per station
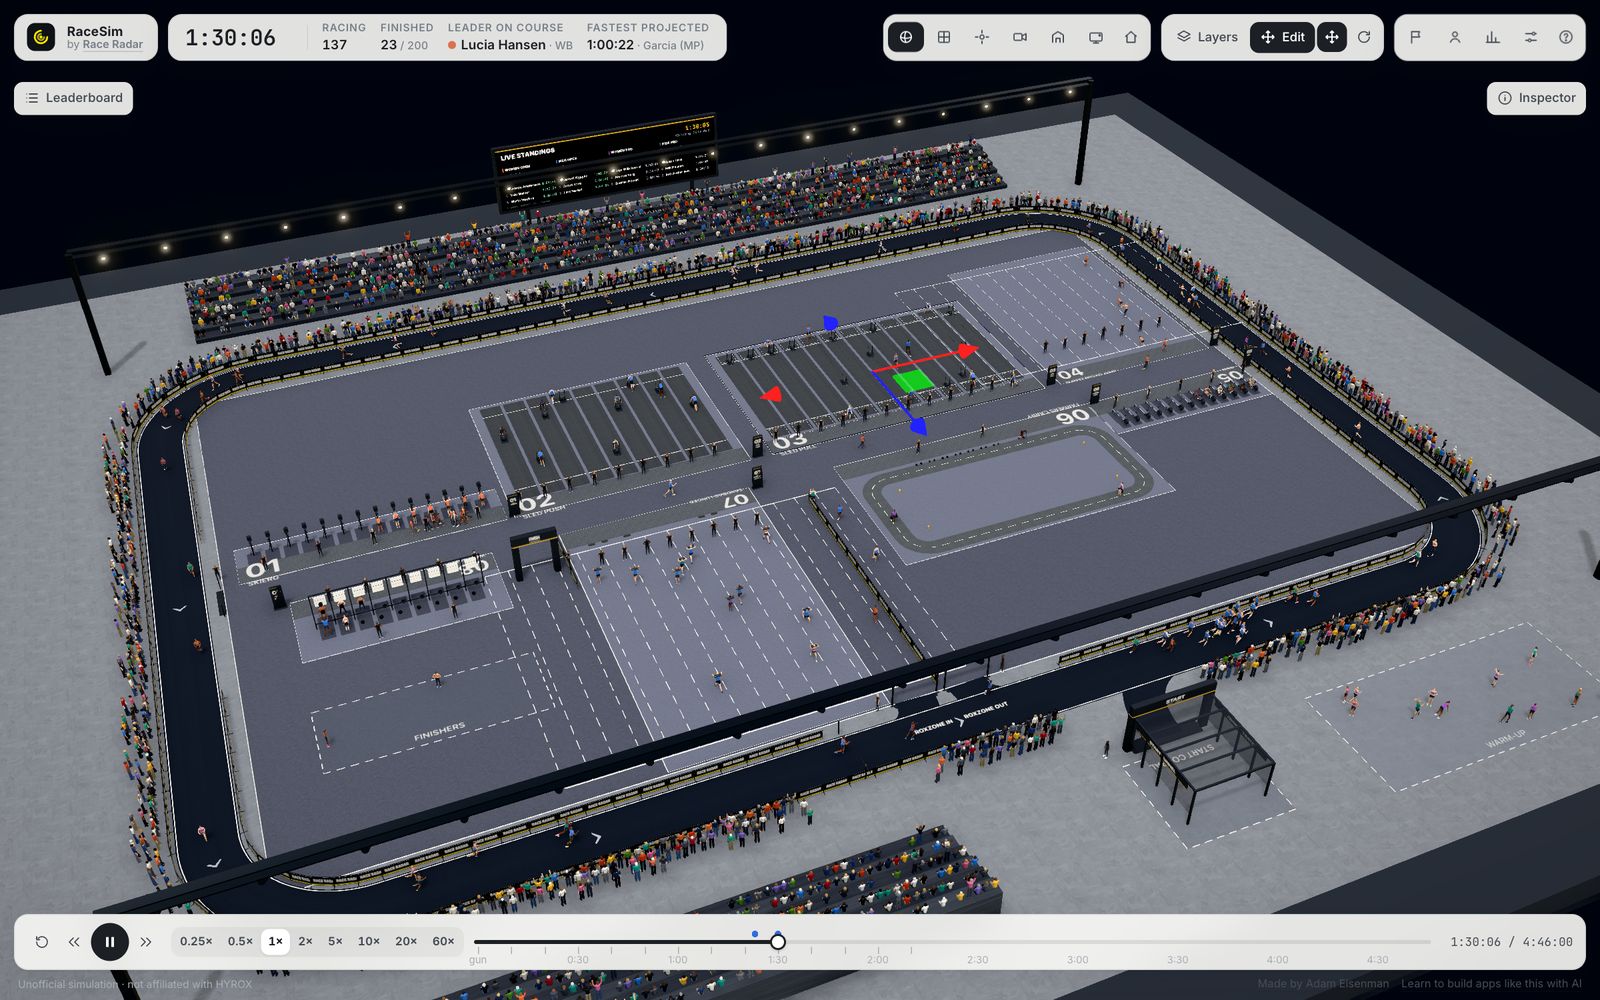
Venue layout
Move or rotate stations in Edit mode and the run course and ROXZONE adapt. Check walking distances, crossings and congestion around the in and out gates before anything is built.
- Try alternative floor plans for a new hall
- Check flow at ROXZONE in and out
- Hand crews a visual of the plan
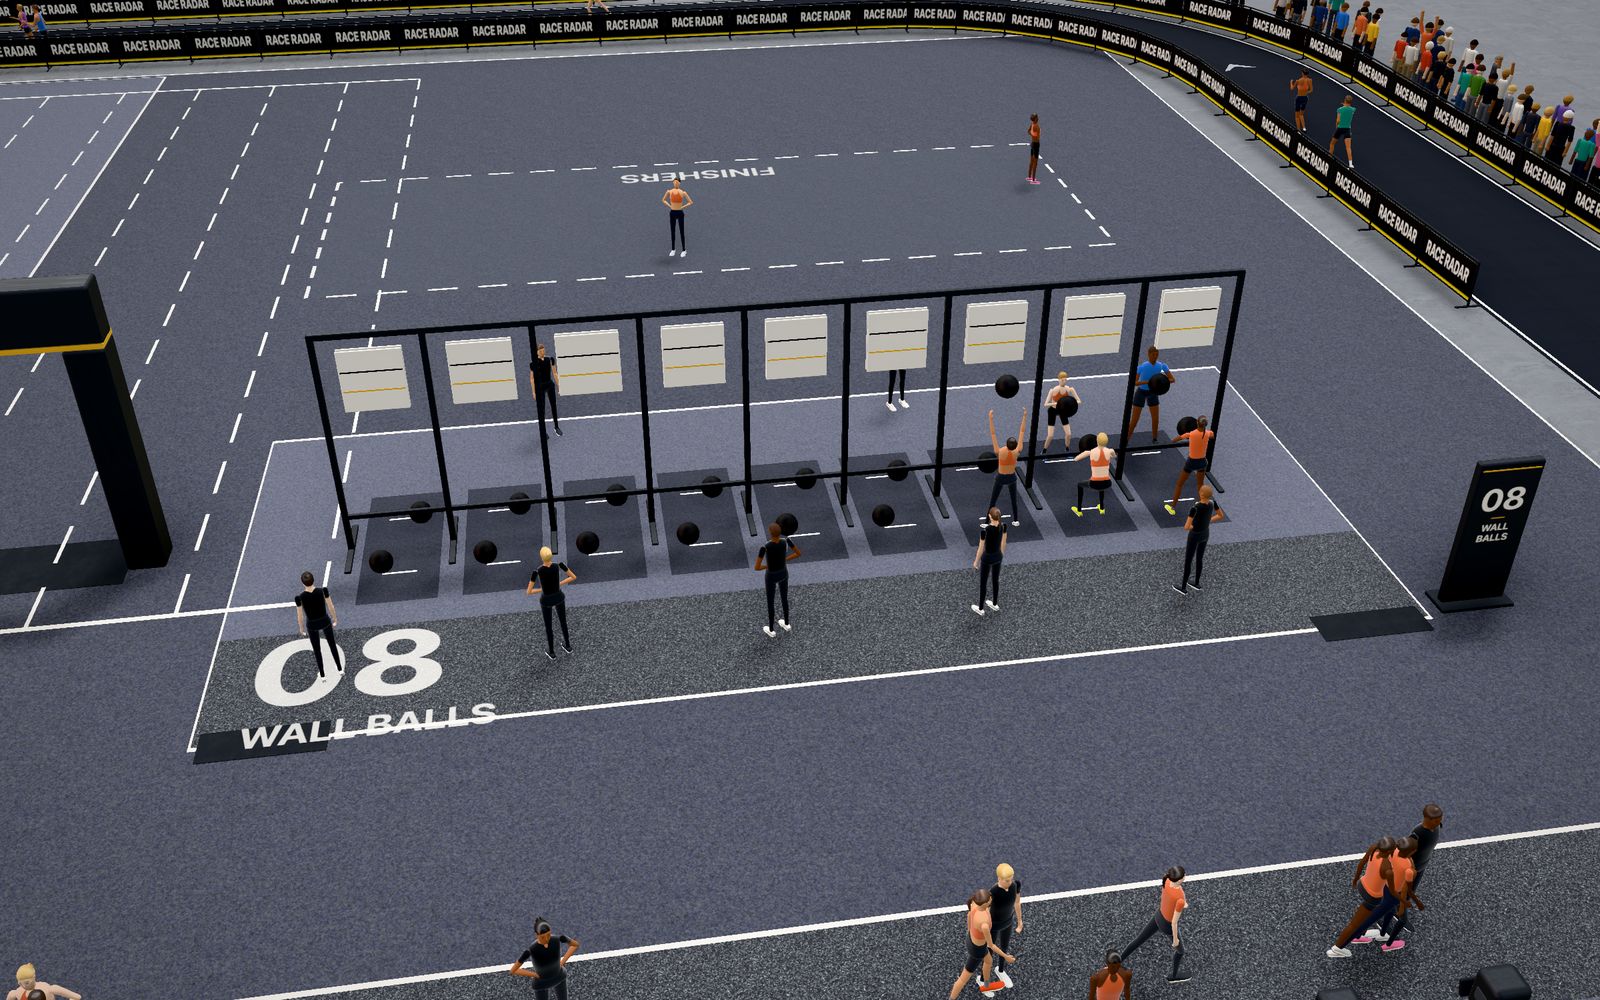
Judges and staffing
Judges and timing staff stand where the work happens: per lane, per few machines, at the arches. Use it to check coverage and to brief volunteers on where they'll stand and what they'll see.
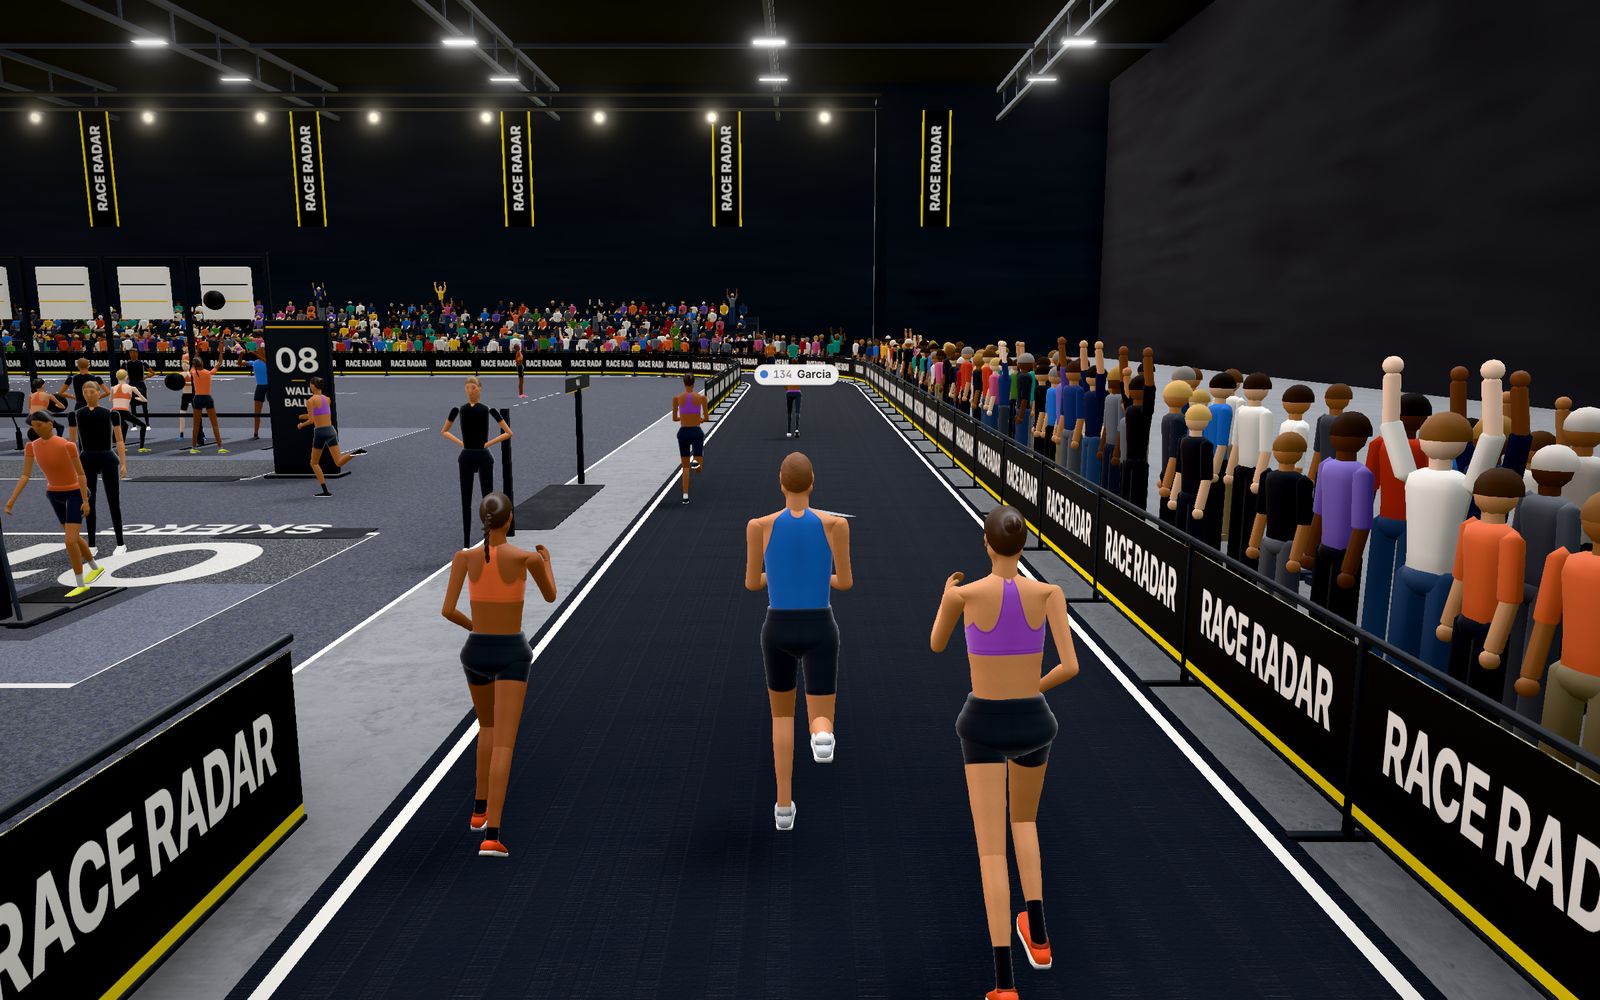
Briefings and first-timer previews
Walk staff, volunteers and first-time athletes through the course: the run loop, the ROXZONE, every station in order. Athletes can paste their own splits and race themselves, and share the link.
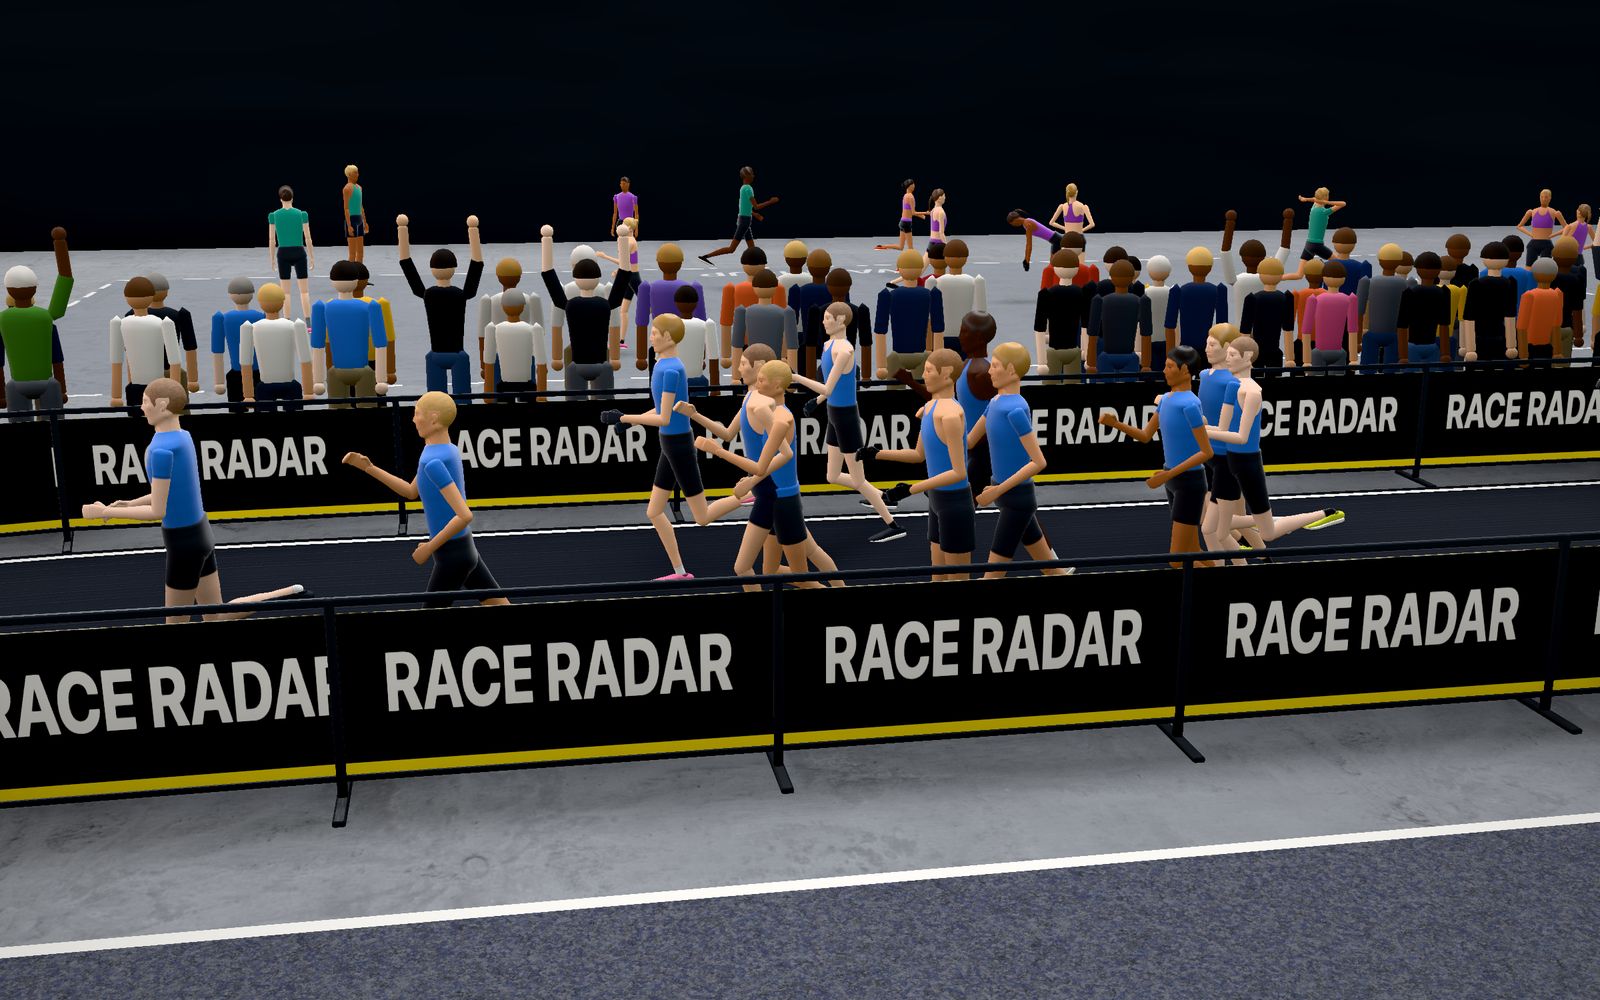
Event screens and commentary
An automatic broadcast camera, live standings and projected finish times give commentators and screens something to show between heats, or before the event to build hype.
Try a scenario in two minutes
Planning an event?
We'd love to hear what your team would want to test: your equipment counts, wave plan or floor plan. Feedback shapes what we build next.